FarmMap is a new generation of mapping GIS for agricultural and estate management purposes. It provides the usual facilities for producing pictures of farms, with crops and other areas in a wide range of colours and styles. In addition, you are provided with the tools to carry out evaluation of analyses, results and field characteristics. All this can be linked to databases and spreadsheets, for viewing and editing of data.
A very short summary of some of the capabilities of the FarmMap program is itemised below.
Generating Farm Maps –
1. Base Data Sources –
- OS Landline Vector Data (1:2,500 and 1:1,250).
- OS Raster (1:10,000). · GPS significant points.
- Satellite images.
- Aerial Photographs.
- Scanned imagery (paper maps and sketches, etc).
2. Drawing Fields –
- Almost instantaneous, using the screen image.
- Very fast, using the OS Vertices.
- Free-hand drawing of polygons.
- Conversion of Optimix field data.
3. Calculation of Useful Areas –
- Tracks and Paths – draw the centreline, then define the width. Instant calculation of area.
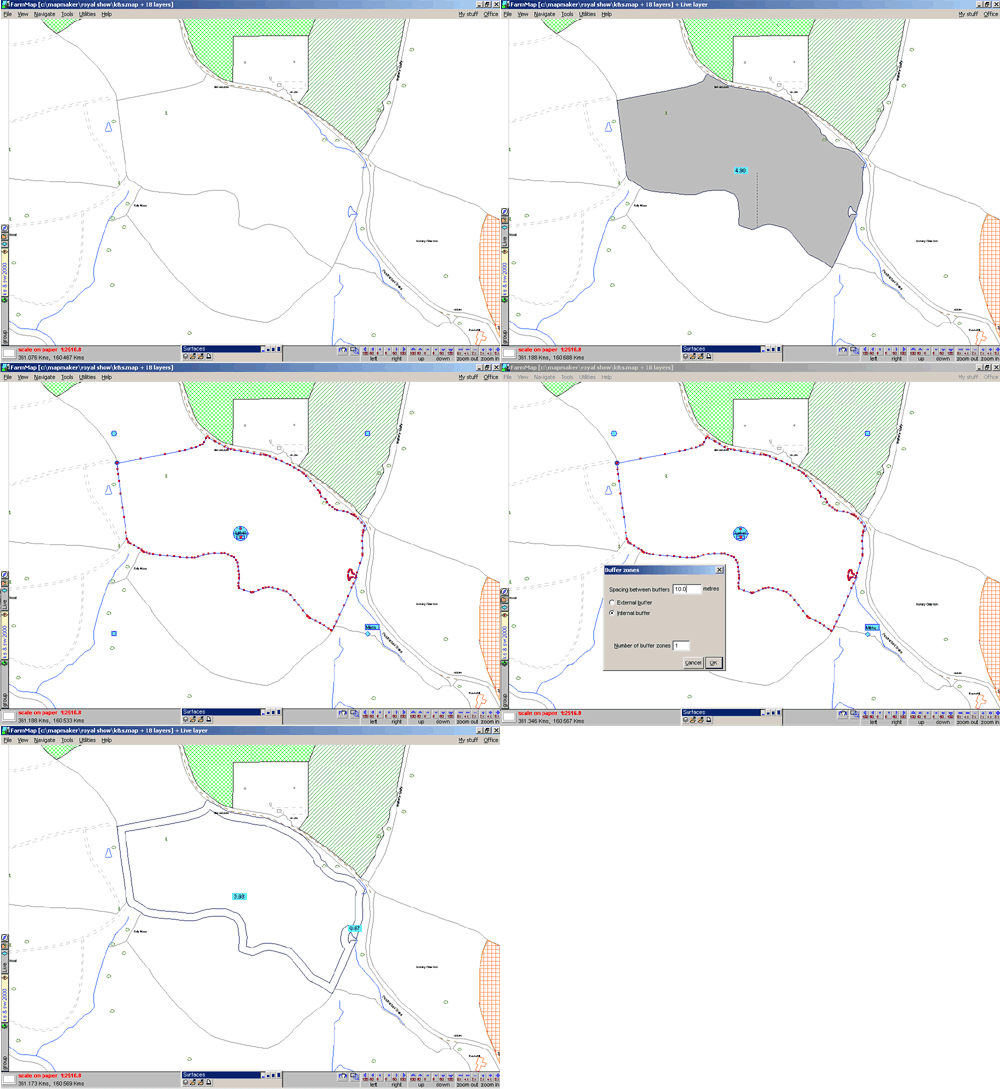
- CSS, Set-Aside, headlands, spinneys – use buffers varying widths and lengths and then calculate the areas. Fast.
- Split fields, crops, etc., and then correct the joining boundaries. Move the boundary of one field and you correct all joining boundaries.
4. Linking to spreadsheets and databases –
- Built-in flat-file database for entering and editing data. Can be linked to any map file that is drawn.
- Can link to existing spreadsheets/databases of other software.
- Link to, and edit, Excel and Access files, as well as Foxpro and Dbase programs.
- Assign coloured styles from databases to polygon files (e.g. crops by colour).
5. Importing analysis data –
- Can display soil analysis data, by element name. Display summary of different elements, together with soil series, crops grown, etc.
- Display yield mapping analysis.
- Combine yield mapping with soil analysis.
- Evolve recommendations for treatment.
- Evaluate potato PCNs, and calculate treatment areas
Here’s a demo showing how easy it is to draw fields and headlands:
